Problem Description:
The Alaska J dataset provides information on humeral robusticity (J) across five distinct categories or samples: Aleut, Coastal/Bay, Far North Coastal, Inland-River, and Tikeraq. The study involves 18 Aleut samples (mean = 2763.34, SD = 454.97), 6 Coastal/Bay samples (mean = 2099.93, SD = 395.72), 27 Far North Coastal samples (mean = 2158.72, SD = 406.42), 27 Inland-River samples (mean = 1947.43, SD = 434.25), and 12 Tikeraq samples (mean = 2206.22, SD = 423.13).
Solution:

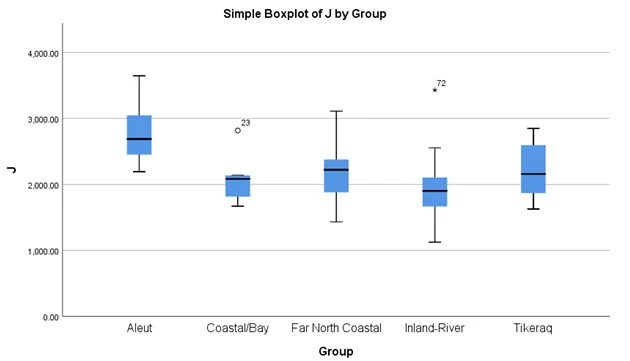
Figure 1: Boxplot of Humeral Robusticity by Samples
The boxplot visually illustrates the distribution of humeral robusticity (J) values across the five sample groups. Notably, Aleut stands out with higher humeral robusticity compared to the other groups. To assess the equality of variance across groups, Levene's test was employed, revealing homogeneity (F(4,85) = 0.359, p = .837).
To delve into potential differences in humeral strength across samples, an ANOVA F-test was conducted, indicating significant variations (F(4,85) = 10.316; p < 0.001). The conclusion drawn was that not all samples exhibited similar humeral robusticity.
A post-hoc Tukey HSD analysis was performed to identify pairs with significantly different humeral robusticity. As per the results, Aleutian Island males displayed significantly larger humeral strength compared to all other samples, while the remaining groups showed similar levels of humeral robusticity.
Assumptions:
- For Tukey HSD: (a) All observations are sampled randomly and independently. (b) The k populations are distributed normally. (c) The k populations all have the same variance. (d) Equal sample sizes among groups are preferable.
- For Games-Howell: (a) The k populations are distributed normally. (b) Each group should have at least 6 observations. (c) No assumption of homogeneity of variance.
- For Tukey-Kramer MCP: Assumptions are similar to Tukey HSD, but it is more robust when sample sizes are unequal.
Problem Description:
The Alaska Asymmetry dataset presents measurements of asymmetry in humeral strength, where higher asymmetry values indicate increased levels of unimanual activity. The dataset encompasses five distinct samples: Aleutian Islands, Coastal/Bay, Far North Coastal, Inland/Riverine, and Tigara. The sample details are as follows: Aleutian Islands (N = 24, M = 14.53, SD = 10.84), Coastal/Bay (N = 4, M = -6.30, SD = 34.65), Far North Coastal (N = 29, M = 8.25, SD = 17.94), Inland/Riverine (N = 30, M = 2.65, SD = 9.20), and Tigara (N = 12, M = 6.51, SD = 12.55).
Solution:

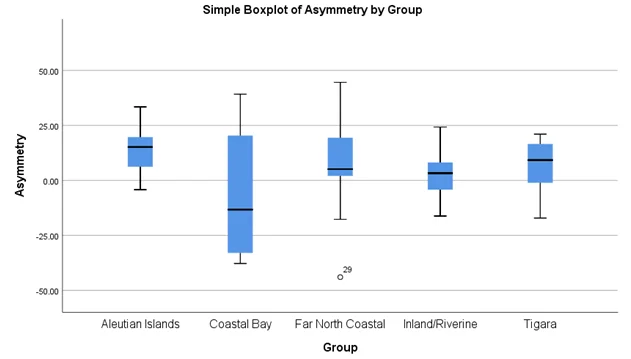
Figure 2: Boxplot of Asymmetry in Humeral Strength by Samples
The boxplot visually represents the distribution of asymmetry in humeral strength across the five sample groups. Notably, the medians of all groups appear to overlap with the interquartile ranges of other groups.
To investigate potential differences in medians of humeral strength asymmetry, a non-parametric Kruskall-Wallis test was conducted. The results indicated significant differences between the samples for humeral strength (H(4) = 12.838; p < 0.012). Subsequently, pairwise comparisons were performed. It was concluded that a significant difference exists between the Inland/Riverine and Aleutian Islands (p = .001), while the other pairs did not show any significant difference in the median of asymmetry in humeral strength.