Problem Description:
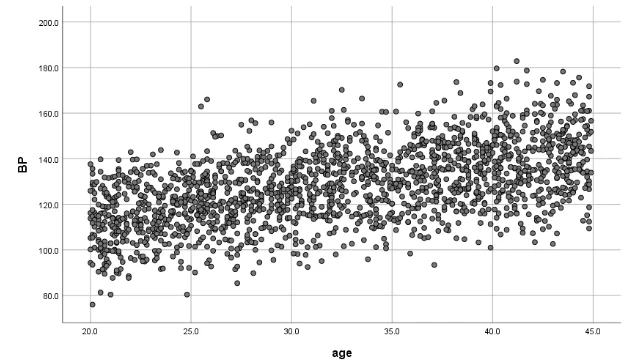
The statistical analysis using SPSS assignment aims to investigate the relationship between blood pressure (BP) and the age of women. A scatter plot visually illustrates the pattern, indicating an upward movement of blood pressure with an increase in age. The goal is to quantify this relationship using a linear model and explore differences in blood pressure between women using and not using birth control pills.

Figure 1: Scatter Plot of Blood Pressure vs. Age
The scatter plot visually represents the positive and linear relationship between blood pressure and age in women.
Linear Model Coefficients:
Dependent Variable: BP
The table above presents the linear model indicating that a unit increase in age corresponds to a 1.218 increase in blood pressure.
Correlations:
Correlation is significant at the 0.01 level (2-tailed).
The correlation coefficient of 0.535 signifies a moderate and significant relationship between blood pressure and age in women.
Group Statistics:
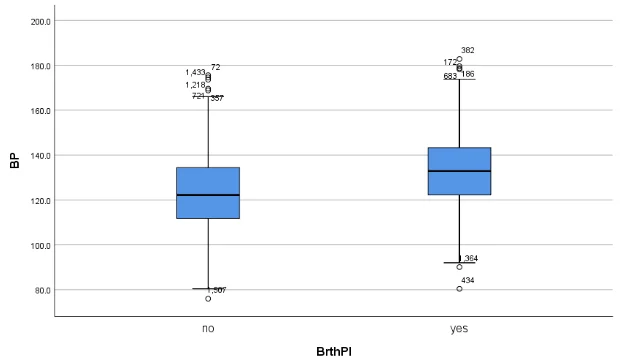
The table summarizes blood pressure statistics for women using and not using birth control pills. Women using birth control pills tend to have higher blood pressure.

Figure 2: Blood pressure statistics between women using birth control and those not using it
Independent Samples Test:
The independent samples test indicates a statistically significant difference in blood pressure between birth control pill users and non-users. Birth control pill users have higher blood pressure compared to non-users.
The analysis reveals a positive and linear relationship between blood pressure and age in women. Additionally, significant differences in blood pressure are observed between women using and not using birth control pills. The findings provide valuable insights into the factors influencing blood pressure variations in this population.