Problem Description:
The statistical analysis assignment aimed to explore the impact of consensus conditions on participants' accuracy scores and confidence ratings in a scenario where individuals evaluate the number of secondary sources supporting a conclusion. The analysis involved a one-sample t-test, Levene's test for variance equality, one-way ANOVA, and post-hoc tests.
1. One Sample T-Test for Accuracy Score:
A one-sample t-test assessed whether participants' accuracy scores in the false consensus group differed significantly from the chance level of 50%. The results indicated a rejection of the null hypothesis (t(99)=13.62, p<.001, d=1.362), suggesting a substantial difference with a large effect size.
Table 1: One Sample T-Test Results
| t | df | p | Cohen's d | |
|---|---|---|---|---|
| SourceAccuracy | 13.620 | 99 | < .001 | 1.362 |
One Sample T-Test
Note. For the Student t-test, effect size is given by Cohen's d.
2. Assumption Check - Levene's Test for Variance Equality:
Levene's test was applied to examine if there was a significant difference in the variance of participants' confidence across consensus condition groups. Results indicated no significant difference in variance (F(2, 297)=1.28, p=.28), confirming the assumption of equality of variance.
Table 2: Levene's Test for Variance Equality
Assumption Checks
| F | df1 | df2 | p |
|---|---|---|---|
| 1.283 | 2.000 | 297.000 | 0.279 |
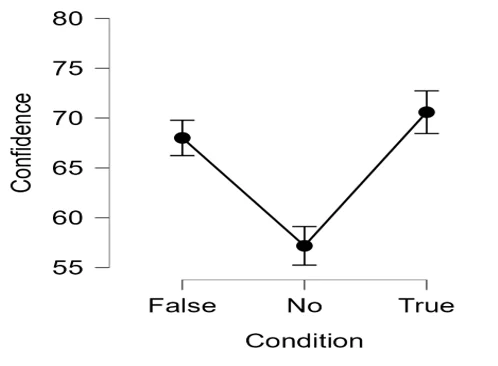
3. Confidence Rating Visualization:
Figure 1: Error Bar Displaying the Mean and 95% Confidence Interval of Confidence Rating across Consensus Condition Group

4. One-Way ANOVA for Confidence Ratings:
A one-way ANOVA investigated whether there was a significant difference in average confidence ratings across consensus condition groups. The null hypothesis was rejected (F(2, 297) = 52.1, p<.001), indicating a significant difference.
Table 3: ANOVA Results
ANOVA - Confidence
| Sum of Squares | df |
|---|---|
| 10125.780 | 2 |
| 28861.940 | 297 |
Note. Type III Sum of Squares
5. Effect Size:
The effect size (η²) was 0.26, indicating a medium effect.
6. Post-Hoc Tests:
Post-hoc tests using Holm’s correction revealed significant differences in average confidence ratings between various consensus condition groups. Notably, the false consensus group had higher ratings than the no consensus group, while there was no significant difference between false and true consensus groups.
Table 4: Post Hoc Comparisons
Post Hoc Comparisons - Condition
| Mean Difference | SE | |
|---|---|---|
| No | 10.830 | 1.394 |
| True | -2.580 | 1.394 |
| True | -13.410 | 1.394 |
Note. P-value adjusted for comparing a family of 3
7. Conclusion:
The analysis revealed that participants prioritized the number of supporting secondary sources, as seen in the higher confidence ratings for the false consensus group compared to the no consensus group. While there was no significant difference between false and true consensus groups, the confidence ratings of the false consensus group closely matched those of the true consensus group.