Problem Set 1: Spatial Memory and Chemotherapy
Problem Description:
A researcher investigates the impact of chemotherapy on spatial memory in rats. The experiment involves training 25 rats in a maze for 30 days, and data on completion times during the last 5 days are collected.
Graphical Representation:

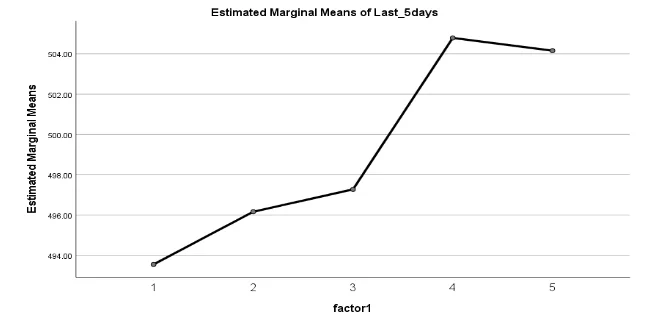
Graph 1: estimated marginal means vs. factor for chemotherapy on rats
Statistical Hypothesis:
- Null Hypothesis: The mean completion times for rats are the same over the last five days of training.
- Alternative Hypothesis: The mean completion times for rats differ for at least two of the last five days.
- Statistical Test: Repeated measures ANOVA (no follow-up comparison needed).
Descriptive Statistics:
- Estimates for the Last 5 Days:
Statistical Hypothesis Test Result:
- Tests of Within-Subjects Effects
Verbal Description of Scientific Result:
- Since p-value (0.621) > 0.05, we fail to reject the null hypothesis. No significant difference, so the second phase of the experiment is not warranted.
Problem Set 2:
Nausea Medications
Problem Description: The study compares the effectiveness of three nausea medications.
Graphical Representation:

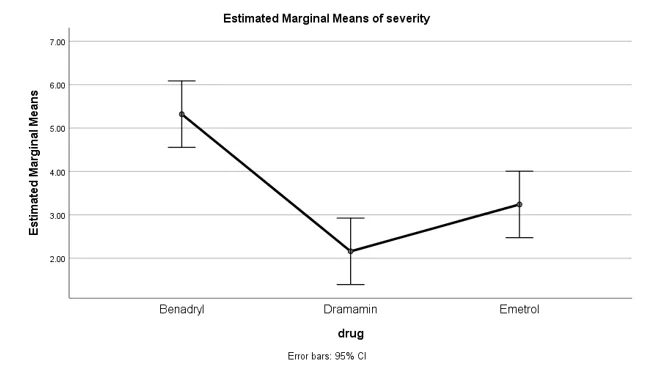
Graph 2: estimated marginal means vs. drug for nausea medication
Statistical Hypothesis:
- Null Hypothesis: The three nausea medications have the same mean severity of symptoms.
- Alternative Hypothesis: At least two of the three nausea medications have different mean severity of symptoms.
- Statistical Test: ANOVA with post hoc LSD tests.
Statistical Test Result:
- ANOVA
- Multiple Comparisons (LSD)
Result Description:
- Since p-value (0.000) < 0.05, reject the null hypothesis. All three drugs have significantly different means of symptom severity.
Problem Set 3: Seizure Reduction Drug
Problem Description:
Researchers test a new drug's effectiveness in reducing seizures.
Expected Effect Size (Cohen's d):
- Cohen's d: 0.9607689 (95% CI: -0.5572812 to 2.411237)
Sample Size Calculation:
- Control group: 23, Treated group: 23 (to detect a significant effect).
Pre/Post Design Sample Size:
- Total sample size: 12 (assuming effect size remains the same).
New Drug Evaluation:
- Use power analysis to determine the trade-offs between increased effectiveness (20%) and higher cost (50%).
Problem Set 4: Chicken Pox Severity
Problem Description:
The study explores how the age of onset impacts the severity of chickenpox in children.
Graphical Representation:

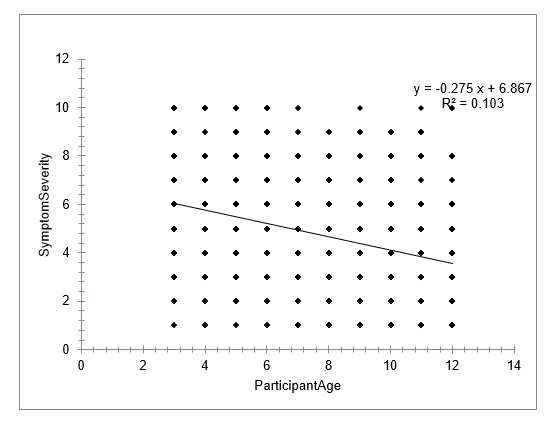
Graph 3: estimating symptom severity depending on the participant’s age
Statistical Hypothesis:
- Null Hypothesis: Age of onset has no impact on chicken pox severity.
- Alternative Hypothesis: Age of onset impacts chicken pox severity.
Statistical Test Result:
Regression Coefficients:
- Intercept: 6.8667 (p < 0.01)
- ParticipantAge: -0.2751 (p < 0.01)
Predicted Severity at Age 5:
- Predicted: 5.491 (95% CI: 5.277 to 5.706)
- Prediction is considered good.
Prediction for 20s:
- No, as the model predicts negative severity, which is out of the range (0 - 10).
Problem Set 5: Blood Sugar Levels and Cereals
Problem Description:
The study examines how different cereals affect short-term blood sugar levels.
Graphical Representation:

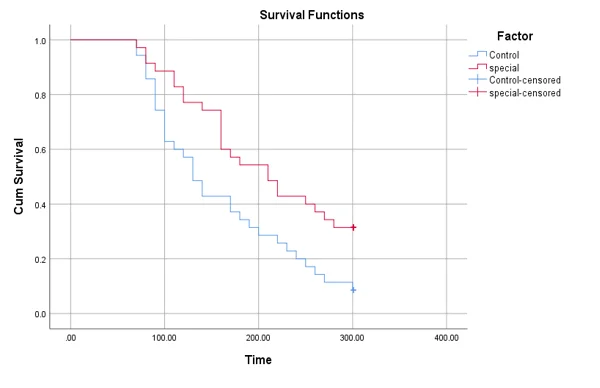
Graph 4: the effects of cereals on blood sugar levels
Censoring in Data:
- Right and Type I censoring.
Statistical Test and Null Hypothesis:
- Statistical Test: Log-rank test.
- Null Hypothesis: No difference in the probability of blood sugar dropping below 100 at any time point.
Descriptive Statistics:
Result Description:
- Chi-Square (Log Rank): 7.030 (df = 1, p = 0.008).
- Reject the null hypothesis, indicating a significant difference between populations in the probability of blood sugar dropping below 100.